October 2005 shootin Spec
Share Market Trading
| Author: | Jack Andrews (effbiae@ivorykite.com) |
|---|---|
| Version: | 1.0 of 20051001 |
Overview
Requirements
The solution is an automatic trading system for the stock market.
Inputs
- daily historical quotes for a range of symbols in the range D0 to Dn in csv format (see 'schema' below)
- a date Ds between D0 and Dn which defines
- the trading period: [Ds,Dn]
- the history period: [D0,Ds)
- definition of buy/sell signals in simple grammar. grammar only needs to supply parameters to the formulae so no complicated parsing is required
- a dollar amount which is the capital to be invested
Outputs
- a list of buy/sell instructions associated with dates in the trading period
eg:
20050601 buy YHOO 1200
20050601 buy PEW  3990
20050602 buy UEP   100
20050602 sell UEP  100
20050602 sell YHOO 600
Solution Assessment
This is not intended to be a competition to make the most money (although the contributors would probably want to try that, too). The aim of each solution is to produce the same (or similar) output to a reference implementation. Sometimes a formulae can be interpreted in more than one way. The faster and shorter programs are usually considered better.
As with all shootin problems, the aim is to collect as much data as possible about the program and the source code and even number of commits to CVS.
Technical Analysis
Technical analysis (TA) is a tool in the toolbox of the methods used to buy and sell shares. Markets trade not only shares but also futures and other mysterious things, all of which are called 'instruments'. Technical analysis can be used to compose a trading strategy based only on historical data: the prices of instruments and the volumes traded.
A seductive introduction to TA is portrayed here at the excellent chartfilter.com and is copied in part here:
Martin Pring, a well known analyst, states the art of technical analysis is "to identify trend changes at an early stage and to maintain an investment posture until the weight of the evidence indicates that the trend has reversed." (Technical Analysis Explained by Martin J. Pring, 1991)
Trend indicators such as trendlines, price patterns and moving averages identify a change in trend after it has taken place. Momentum indicators, such as ROC, RSI and MACD, can warn of strength or weakness in the market, often well ahead of the final turning point.
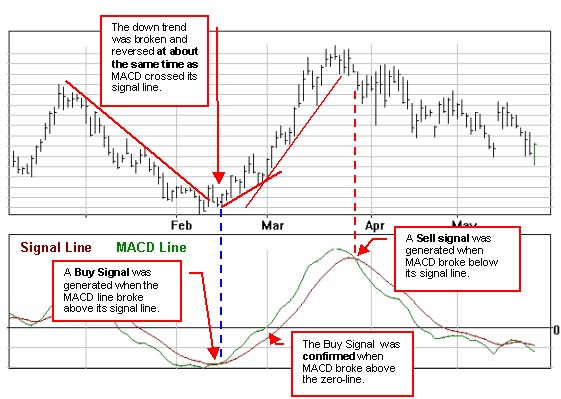
Consider the popular MACD indicator, for example, in the charts below. The MACD chart is shown underneath the price chart. As you can see from the example below MACD can help catch a reversal in the overall price trend, providing very useful buy and sell signals and alerts. Here we can see where the down trend was broken, providing the first alert that a market reversal could be underway. When MACD broke through its signal line we had a confirmation that the market had reversed. And a second confirmation came when MACD broke upwards through the zero line. The market then began a strong uptrend and MACD even proceeded to let us know when it was time to sell! See the section on MACD for much more information on using this handy indicator.
chartfilter.com will teach you a lot about TA but this spec will contain all you need to provide a solution.
Background
A simple model will be used to filter out stocks that show no movement and then a trading strategy will be applied to buy and sell these stocks.
Stock Scan
In brief, a stock scan picks the stocks likely to move.
"A stock scan applies a technical formula to a large population of stocks and returns a list of stocks that meet some filter criteria associated with that formula". (from stockcharts: stockScans.html)
the filter criteria is usually designed to catch stocks that are moving in one direction or the other as opposed to going 'sideways'. such a filter is called a 'trend indicator'. a simple example of a trend indicator is: 'the stock has set a new 52-week high or low'.
Trading Strategies
A trading strategy is
Enter when price crosses above 10-Day MA. Exit when the daily bar closes below 10-Day MA. Entry: buy, Exit: sell.
Enter when daily price bar breaks out above Upper Bollinger Band. Exit at 5% Profit or after 3 days. Entry: sell, Exit: buy
MA and Bollinger Bands are defined below.
Reference Implementation
ta-lib, as it's name suggests, is a library of TA functions and a bit more. For our purposes, it is most useful in defining the formulae above in c. ta-lib provides a Perl interface (and an under-developed Python interface) which we will use as the back end.
Building ta-lib
Get, Make, Install
Point your browser here, (takes you to a 'choose a mirror' page). and unzip it at $TAROOT. (TAROOT=any/directory/you/want) The following builds the Perl module and binaries such as ta_yahoo which downloads quotes from finance.yahoo.com
$ cd $TAROOT/ta-lib/c/make/cmr/linux/g++/
$ make
$ ls $TAROOT/ta-lib/c/bin |grep -v HOLDER
gen_code  gen_data  gen_rdata  ta_regtest  ta_sql  ta_yahoo  webfetch
$ cd $TAROOT/ta-lib/swig/make/perl/linux/g++
$ make
$ cd $TAROOT/ta-lib/swig/lib/perl
$ find . -type f |grep -v HOLDER
./Finance/TA.pm
./TA.so
ta_yahoo
ta-lib provides a featureful program for downloading data from yahoo's financial database. ta_yahoo was built in the sequence above.
here is ta_yahoo's usage:
$ $TAROOT/ta-lib/c/bin/ta_yahoo
ta_yahoo V0.1.4 (Oct  4 2005 12:46:07) - Fetch market data from Yahoo!

Usage: ta_yahoo -c
      ta_yahoo -s <category>
      ta_yahoo -{d,u,i,z}{d,w,m,q,y} <category> <symbol>
      ta_yahoo -{d,u,i,z}{d,w,m,q,y} DIRECT=US <Yahoo! symbol>

 -c Display all supported categories.
 -s Display all symbols for a given category.
 -d Fetch split and dividend adjusted data.
 -u Fetch non adjusted data.
 -i Fetch dividend-only adjusted data.
 -z Fetch split-only adjusted data.

 {d,w,m,q,y} = "daily,weekly,monthly,quarterly,yearly"

 Specify "DIRECT=US" to use Yahoo! names directly with the US
 web site of Yahoo! instead of the TA-Lib category/symbol index.
 Use double quote when symbol name contains special characters.

 Stock output is "Date,Open,High,Low,Close,Volume"
 Funds output is "Date,Close". Date are "mm-dd-yyyy"

 For period greater than daily, volume is the daily volume average.

 Examples: ta_yahoo -s  US.NASDAQ.FUND
           ta_yahoo -dd US.NASDAQ.STOCK MSFT
           ta_yahoo -ud US.NASDAQ.STOCK MSFT
           ta_yahoo -zw US.NASDAQ.STOCK MSFT
           ta_yahoo -dd DIRECT=US 2812.TW
           ta_yahoo -uy DIRECT=US "^DJI"

 This utility may creates files "y_xx.dat" to speed
 up subsequent remote access. These are automatically
 re-generated and can be safely deleted.

 * Data cannot be resdistributed. You must respect
 * Yahoo! terms of service (www.yahoo.com)

 Online help: http://ta-lib.org
Formulae
FMLabs defines all the major formulae used in TA
We use a selection of the formlulae used in TA.
Moving Average
- "A very simple measure which indicates trends and trend reversal".
- see MA at chartfilter.com
The moving average (MA) of period 2 on the list 1 2 3 2 1 is _ 1.5 2.5 2.5 1.5. the _ in the result indicates that there is no first element that corresponds to the the first element in the original list. This is because MA is defined (in python) as:
P=2
list=map(float,[1,2,3,2,1])
result=[sum(list[i-P+1:i+1])/P for i in range(P-1,len(list))]
But there's more to the MA than this -- there are 4 types of MA:
- Simple (the definition above)
- Linearly Weighted
- Exponential
- Variable
DMI
DMI is used to determine trend. DMI is used to classify instruments as either going up, down or sideways.
The Rest
- MACD
- Stochastics
- fast
- full
- Bollinger Bands
- other
Attention!
The DMI formula and the rest of the formulae will be defined shortly. Anyone with a good source of formula definitions, please let me know -- i'm having a hard time finding anything through google.
Mechanism
Firstly, the program (let's call it 'tr') must retain data (or some of the data) given it. Then it must wait for instruction for trading strategies:
$ tr 20050101 quotes.csv #start trading from Jan-1 given quotes
screen xtrm 52w          #choose candidates with extreme value over 52w
screen macd 26 12 9      #... and macd with conventional parms
buy    adx  >25          #buy when adx goes up through 25
sell   adx  <20          #... down through 20
buy    mmtm >0           #buy when momentum goes up through 0
sell   mmtm <0           #... down through 0
trade  4w                #trade for 4 weeks of data (in quotes.csv)
Acknowledgements
chartfilter.com has not been approached for money to promote their web site and has not offered any money to be included in this spec. they simply have good educational material on their website. if you find better, please let me know.
Dennis Sasha's FinTime which helped my with my terminology and gave me some enthusiasm for automated trading.
Notes
pyq
Historical prices can be retreived using pyq. pyq obtains quotes from finance.yahoo.com. It caches data on disk so you won't need to download quotes twice. You may need to install python if you don't already have it
For example, typing in the following command retrieves the data for IBM and AT&T for the first week in April 2001:
$ pyq 20010401 20010407 ibm t

ibm,20010406,97.6322,99.6247,96.0382,97.5824,13424200
ibm,20010405,95.4404,99.6247,95.1715,97.8414,12506100
ibm,20010404,90.1105,93.697,89.712,91.6547,13515600
ibm,20010403,94.245,94.2948,89.7618,90.0508,13330000
ibm,20010402,97.0843,97.7318,93.2288,94.3047,8787000
t,20010406,15.6928,15.7002,15.1323,15.3191,8679900
t,20010405,15.3565,16.0664,14.9455,16.0664,10263900
t,20010404,14.9754,15.3266,14.9455,14.9679,10020400
t,20010403,15.3938,15.5059,14.8334,14.9754,15605300
t,20010402,15.9169,16.4326,15.5134,15.7525,13925000
The schema of the above csv is:
ticker, date, open, high, low, close, volume
For the mechanism, maybe tr will access pyq by reading the environment variable PYQ which is the absolute path to the pyq executable.
eg:
$ export PYQ=/home/jack/shootin/pyq
$ cat test.c
  main(){printf("%s\n",getenv("PYQ"));return 0;}
$ gcc test.c && ./a.out
  /home/jack/shootin/pyq